
Paper Marks Are Lying to You
It’s Time to Ditch Paper Valuations and Start Measuring Real Portfolio Health

Paper marks in venture may be one of the most misleading metrics for any allocator or General Partner. They are frequently cited as a measure of portfolio performance yet fail to assess the underlying assets' health objectively. I believe it’s time to rethink —or even move beyond—paper marks altogether.
The Illusion of Paper Marks
Let’s break it down with a simplified (and redacted) portfolio. Consider a $100 million Seed fund with a concentrated portfolio of 20 companies. The fund is fully deployed, and for simplicity, let’s assume the fund holds a 10% ownership stake in each company.

On the surface, things look great. The portfolio is marked up to 2.8x and heading towards top quartile performance. A few breakout companies are leading the way, and at first glance, it looks like a classic venture success story. The GPs are congratulating themselves, patting each other on the back, and talking about how lucky they were to back Company 20. Prospective LPs might review these numbers and think, “These folks get it. They’re playing the power law well and landing in the right deals.” But here’s the real question—what actually constitutes a healthy portfolio? Can we trust paper marks to answer that?
Introducing The ‘Revenue Value Multiple’
Let’s go deeper. The portfolio is currently generating $257.8 million in revenue. If we assume this is a SaaS-heavy portfolio, we can apply a reasonable long-term public market revenue multiple of 7.0x. That gives us a total Portfolio Value (revenue x multiple) of around $1.8 billion. Our assumed 10% ownership means a ‘Revenue Value’ of the portfolio of $180 million.
Now, remember, our fund size is $100 million—so our ‘Revenue Value Multiple’ is 1.8x. That’s noticeably different from the 2.8x the paper marks suggested. Some companies may be performing stronger than their paper marks imply. Others? Not so much. What initially appeared to be a top-quartile performing fund suddenly seems far less compelling when benchmarked against liquid public market alternatives.

Assessing the Health of a Portfolio
Using the ‘Revenue Value Multiple’ provides us with a different portfolio evaluation method. If we compare each company’s paper mark against its Revenue Value, we can categorise companies into three key buckets:
Green (undervalued): Companies where ‘Revenue (x)’ exceeds ‘TVPI (x).’ These are companies that might be flying under the radar, potentially worth more than they’re marked at.
Blue (fairly valued): Companies where the paper mark is roughly in line with their commercial traction.
Red (overvalued): Companies where the paper mark significantly exceeds their commercial performance. This is where the trouble lies.
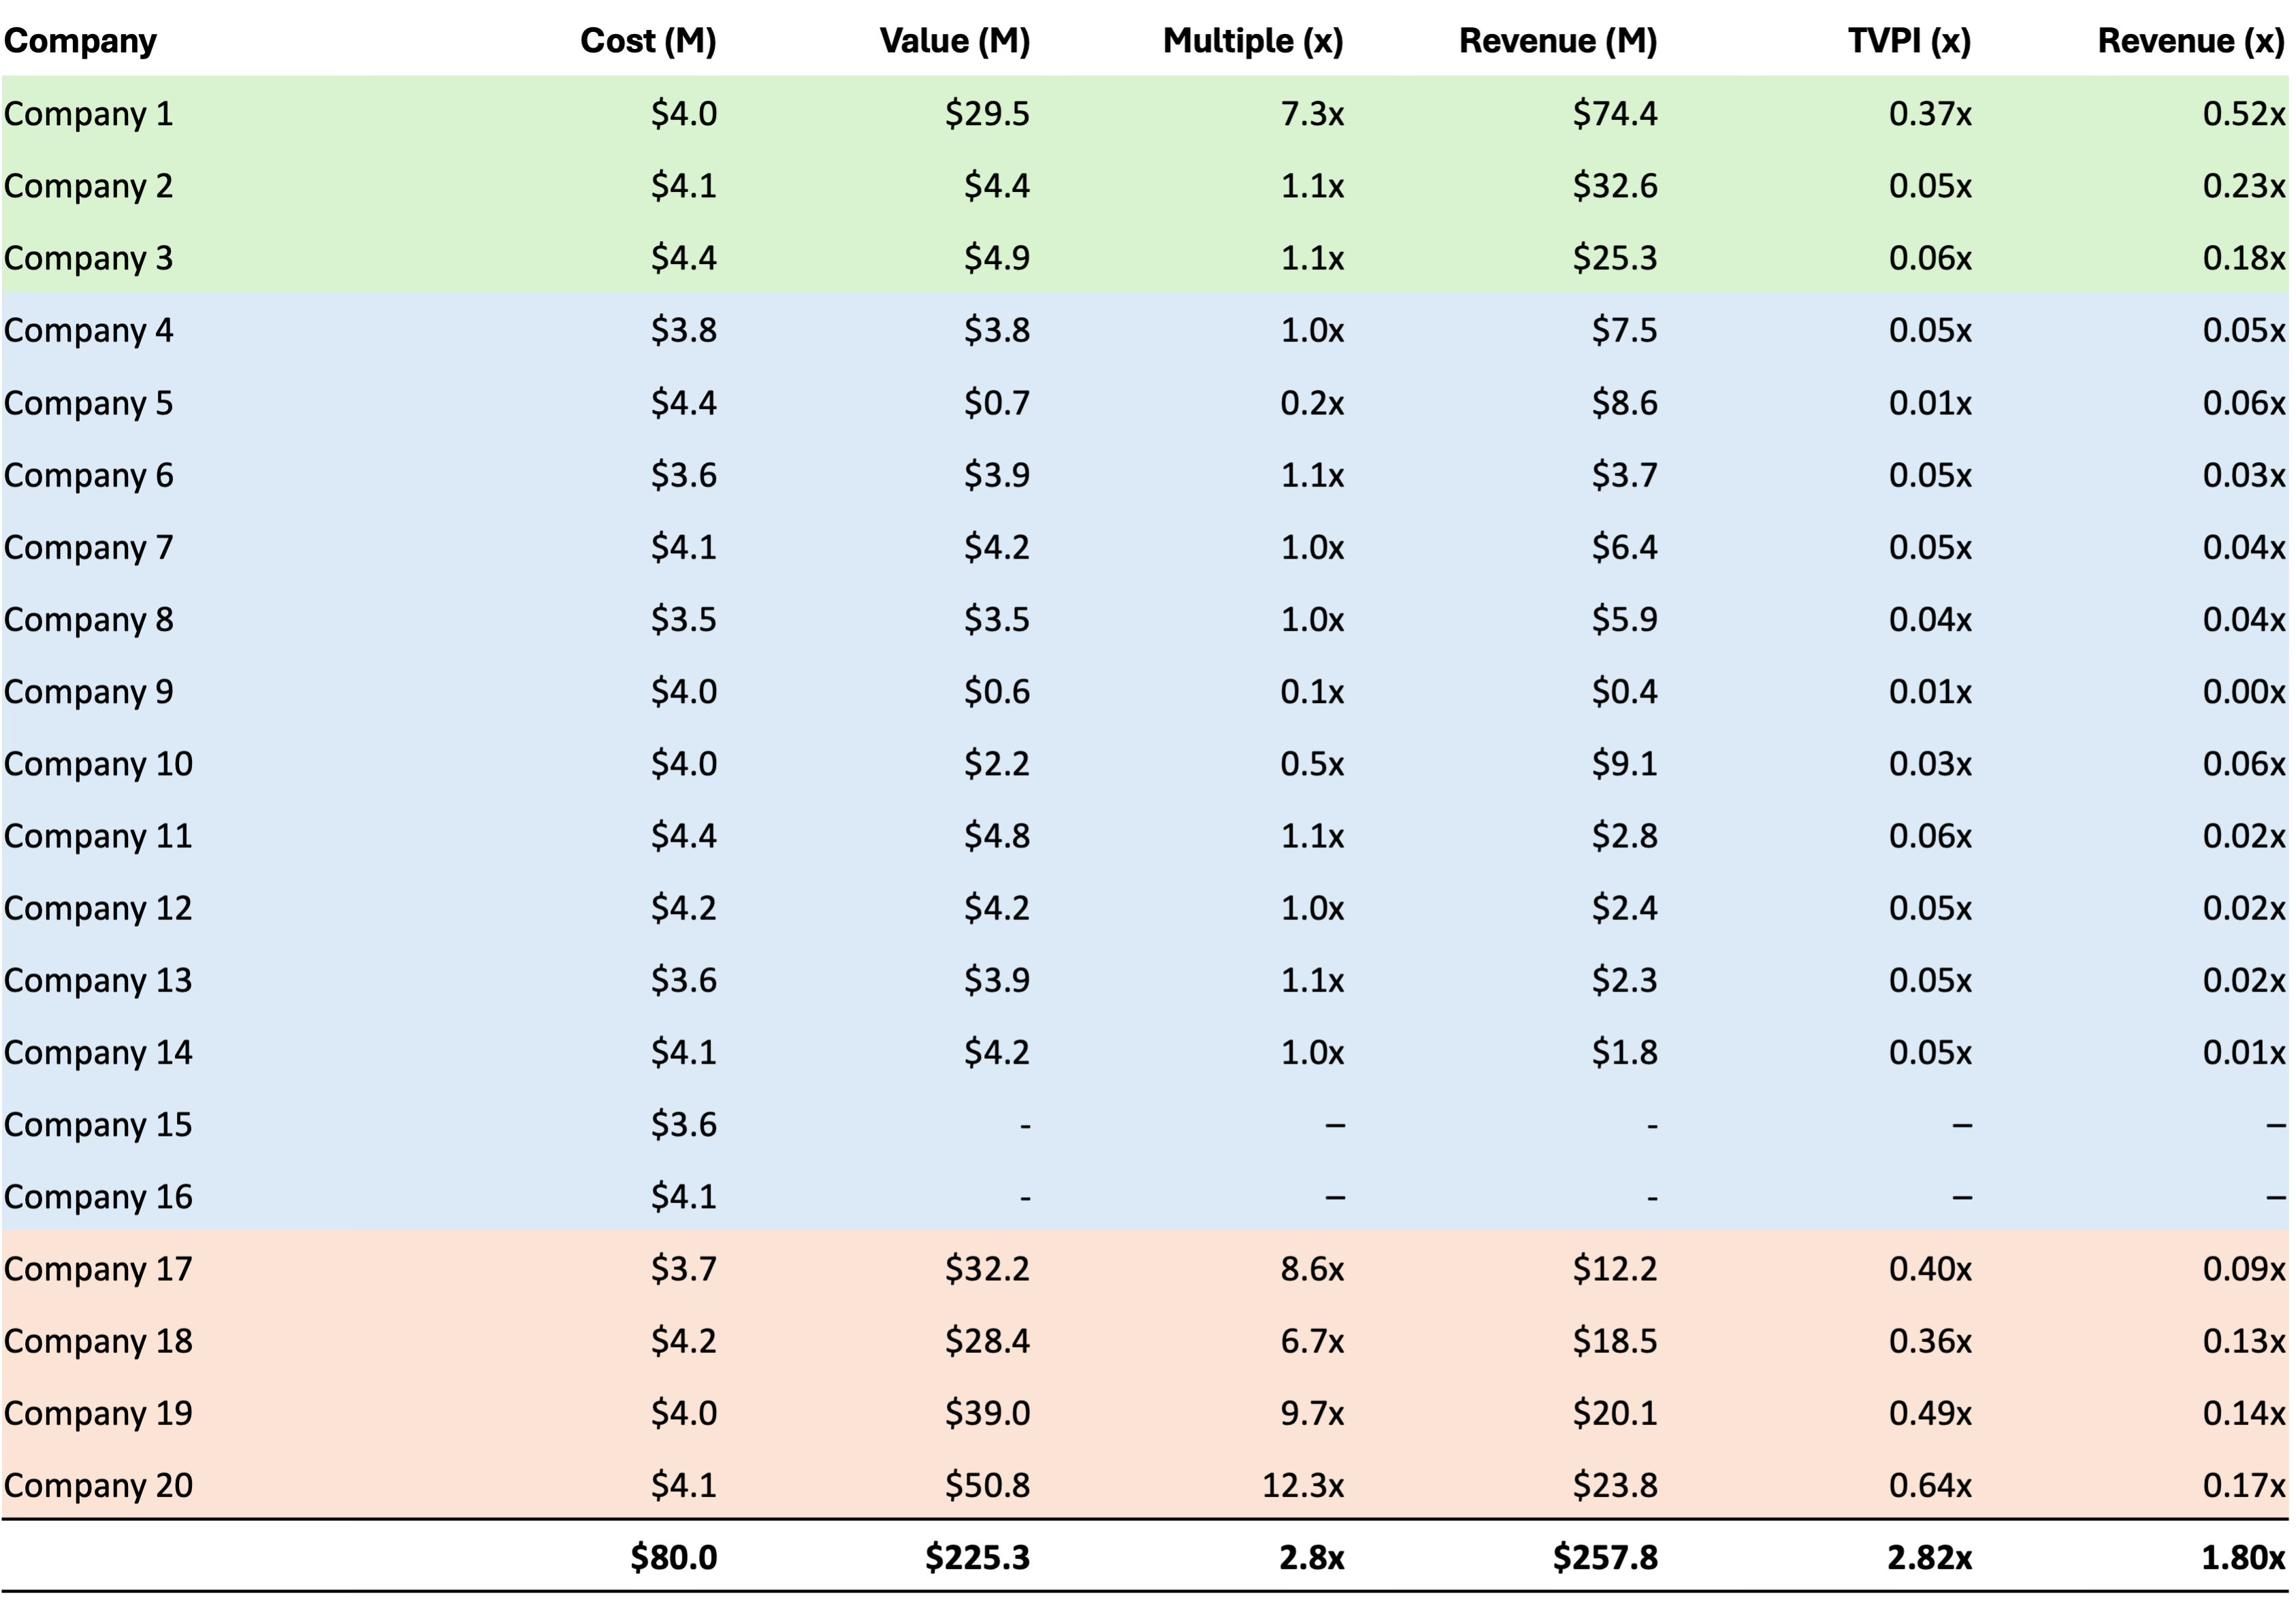
Now, back to Company 20—the one the GPs were bragging about. Turns out it’s in the red zone. The paper mark suggests it’s a winner, but its commercial performance says otherwise. This is where the Revenue Value Multiple should become an essential tool—it offers an objective measure that cuts through the hype and provides a clearer picture of true portfolio health.
For GPs, this exercise is a gut check on portfolio performance. For LPs, it offers a transparent view of objective value. In some cases, the findings may be encouraging—perhaps the fund’s true value is higher than the paper marks suggest. In reality, the opposite will often be true in today's market. As the example above shows, many companies remain overvalued relative to their commercial performance.
The Issue Today: Venture’s Unicorn Landscape
Right now, 517 global unicorns last raised funding over three years ago, per Crunchbase data. For top-tier companies, raising a follow-on round typically happens within three years—often much sooner. If a company has gone four years without fresh capital, the odds of a new round happening are slim.
If a company hasn’t raised in years, is it still worth its paper mark? More often than not, the answer is no. The market has changed. Many of these unicorns will be in the red zone and won’t come close to their listed unrealised value.
The key takeaway? Paper marks alone are not enough. They are subjective, misleading, and frequently based on outdated information. Instead, current portfolio performance needs to be tied to real-world metrics. The ‘Revenue Value Multiple’ provides a clear, objective framework to achieve this. It’s a simple yet powerful tool providing greater transparency for both GPs and LPs.
More funds should use it, and more LPs should assess it.
Thanks to Matt Sacks, Managing Partner at Lightbank, for inspiring these thoughts.
Really useful. Had been thinking about this as well. I am generally down on paper marks and had looked at Revenue Value as the only sensible way forward. However, hadn't pulled it together so was delighted to read yours.
Very interesting point! I can really see how this should apply for funds where the strategy is to exit at the time of an IPO. How about if the exit strategy is rather to sell secondaries in later VC rounds before an IPO or acquisition? Would it make more sense to report paper valuations or would revenue based valuations still be preferred?